Advanced Analysis
Agenda
After reading this article you will be able to understand which insights can be extracted during ELF runtime and what tools can help you do so.
The following subjects will be covered in this article:
- Linux Processes
- ELF Syscalls
- Persistence Methods
- Network Sniffing
- Sandboxes
After covering our dynamic analysis toolset, we will put them to use by practicing on a real sample found in the wild.
Analysis Environment Preparations
Before we get started, let’s prep your Linux VM (virtual machine). If you don’t have a Linux VM, follow this guide to install one.
Needless to say, running malware should only be done in isolated environments such as VMs. Even when using a VM the malware can cause harm, not only to your system but also to other machines over the internet. For example, running a worm can spread it over the network (see New Golang Worm Drops XMRig Miner on Servers). Running ransomware or stealers can encrypt and/or collect information from your VM, including files located on the shared folders with your host.
Make sure that before you run a malware your virtual environment meets the following criteria:
Your machine host name and user name are generic. Run
uname -nto see the host name of your machine, and rungetent passwd {1000..60000}to list all human usernames on the machine.Your IP is not easily trackable. Blurring your public IP can be done in several ways:
- Basic: Use a VPN service on your
host machine during dynamic analysis. The traffic from your VM should be
tunneled through your host. Verify your public IP from within the VM by
running a command such as:
curl 'https://api.ipify.org'. There are various free VPN programs you can use such as OpenVPN. - Advanced: Use a second VM as a router that tunnels traffic, via Tor for instance. Establishing that, you can route the entire network from your malware analysis VM through the router VM.
Note that you can always disconnect your machine from the internet and start the dynamic analysis with no network connection as a first step.
- Basic: Use a VPN service on your
host machine during dynamic analysis. The traffic from your VM should be
tunneled through your host. Verify your public IP from within the VM by
running a command such as:
Your machine is clean from private information. Make sure that you don’t have any passwords, API keys, etc. written on the machine.
Disable shared folder and shared clipboard before running the malware.
Setting Up SSH Connection
Use SSH to transfer files from your machine (host) to your VM (guest). Follow these steps to establish connection:
Install OpenSSH on your VM:
sudo apt-get update
sudo apt-get install -y openssh-server
Shut down your VM.
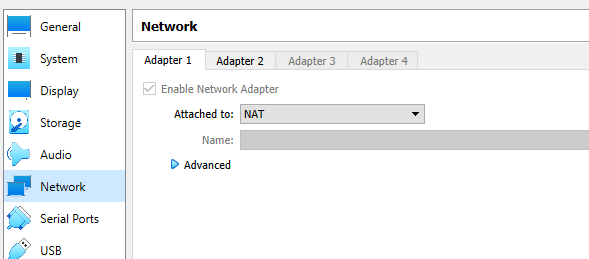
- Go to Settings > Network. Adapter 1 should be set to NAT:
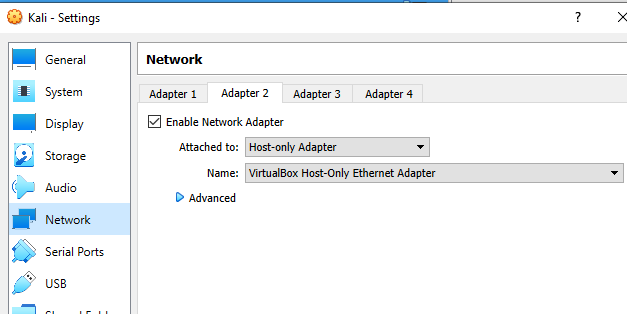
- Add a second adapter: Choose “Host-only Adapter” and apply changes.
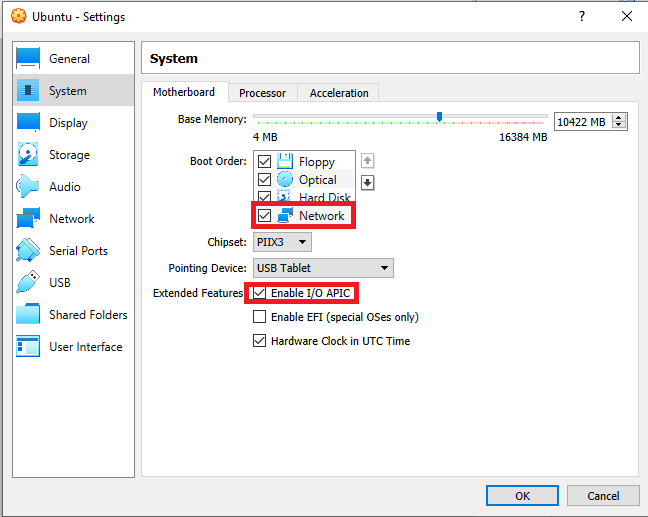
- Go to Settings > System > Motherboard and make sure these entries are enabled:
- Start your VM and get the LAN IP address of the VM instance. Run
ip addr show.
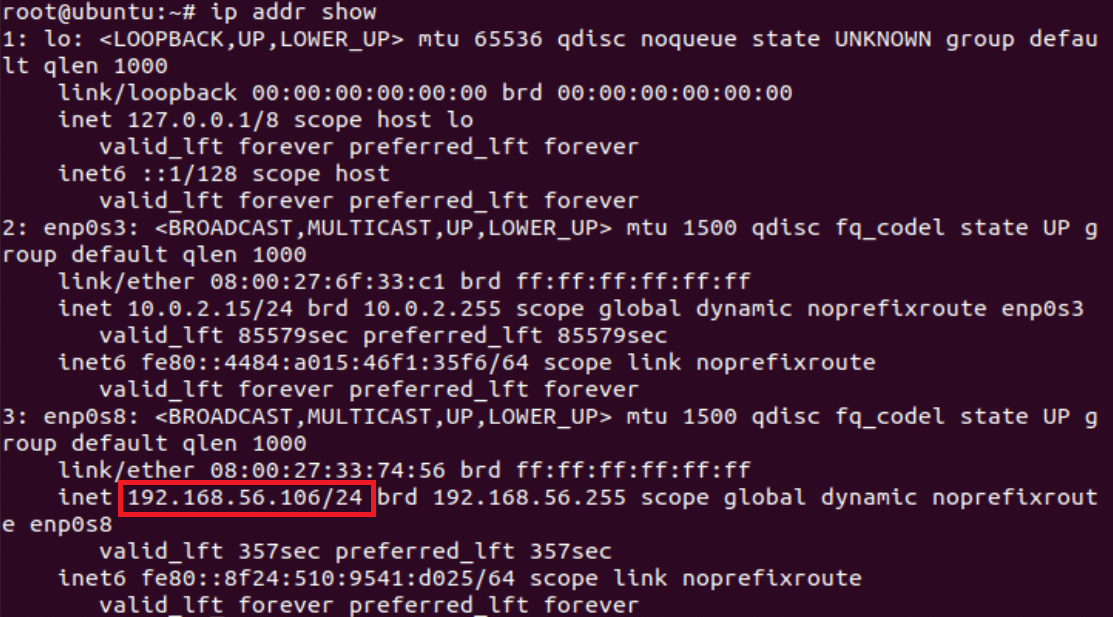
Make sure the OpenSSH service is active on the VM by running:
sudo service ssh status.You should now be able to connect from your host to the guest machine via SSH. Using
scpcommand you can copy files and directories from your host machine to the VM. Run on your host:scp -r myhostpath VM-username@/path/to/whereyouwant/thefile
Linux Processes
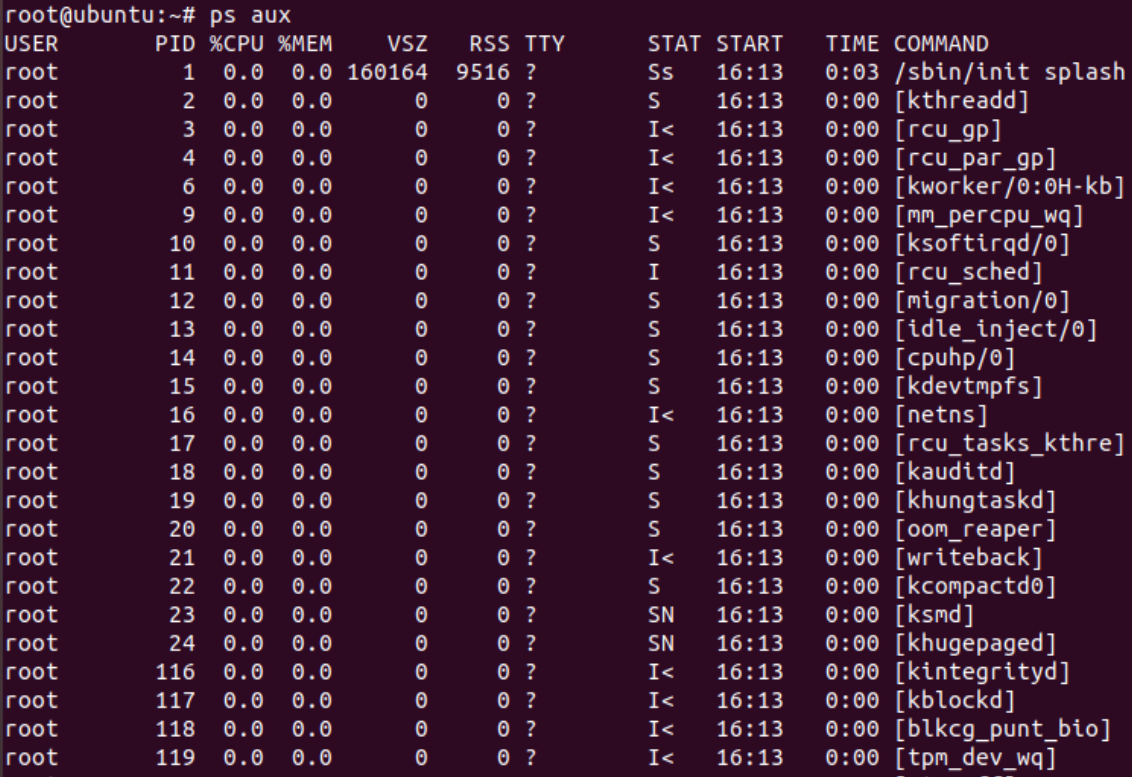
Every instance of a running program on the system is a process. Each process
has its unique process ID. You can see all of your processes by running
ps aux. The ps command
displays information about the process that ran at the exact time you ran the
ps command. To see an ongoing repetitive output use
top.
The proc Filesystem
The “proc” filesystem is a pseudo-filesystem provided by the Linux kernel. It
provides an interface to kernel data structures which includes information
about all currently running processes. It will commonly be mounted under the
/proc directory. Each process has its own directory under /proc and the
directory name is the process ID.
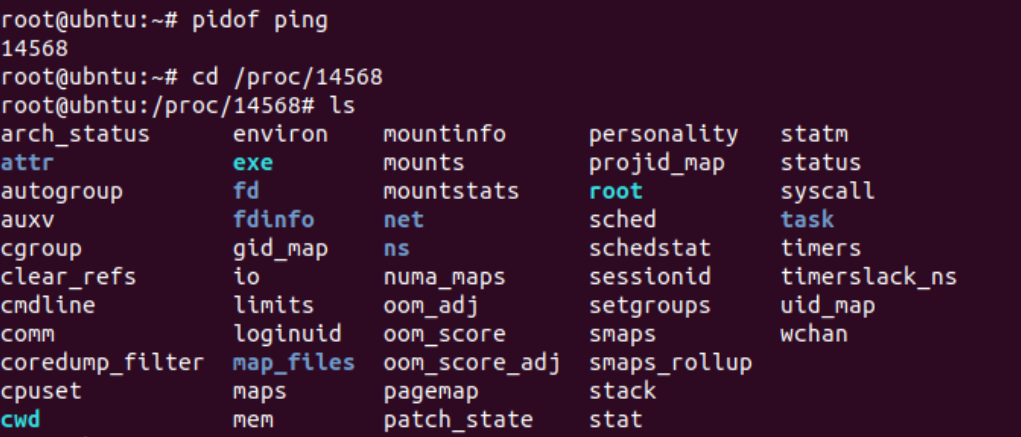
To get a better understanding of the proc directory, open two terminals on your
Linux VM and run ping 8.8.8.8 on one of them. On the second terminal, run
pidof ping to retrieve ping’s process ID.
Let’s review the process directory by browsing the /proc/PID directory and
running ls. You can see that it has different directories and files. All
process directories share the same structure, filenames and directories. Figure
2 describes the flow above.
The following are some interesting files that will be present under every process directory:
cmdline - command line arguments that ran the file.
status - process status in human readable form.
maps - memory maps regions and their access permissions.
exe - symbolic link containing the pathname of the executed command.
Attempting to open it will open the executable. Try running sha256sum exe and
sha256sum on the ping file: sha256sum $(which ping). You will see they
match.
After you kill the ping process, you will see the /proc/PID directory no
longer exists.
Browse here for more information about the proc file system.
Process Tree
The process tree structure can give you insights about what is running on a machine before diving into specific processes.
A single executable can create more than one process on the machine. Let’s
emphasize that by using the pstree command to view the running processes as a
tree. The following are some examples of what the process tree will look like
for each scenario:
- Other process creation: A process can call other processes. Let’s
compile a simple program that runs a ping command via bash and name it
ping-google-dns:
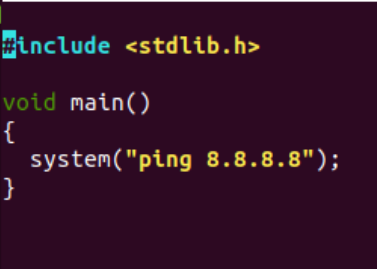
Let’s run the program and on another terminal run
pstree | grep ping-google-dns:

We ran the ping-google-dns program from a terminal (bash process) which
called sh binary (a command language interpreter) that called the ping
binary.
- Forks:
fork()creates a new, duplicate process of the called process. The new process is called a child process and it will have a different process ID than its parent. Let’s re-compile theping-google-dnssource code, this time with the addition of afork()call.
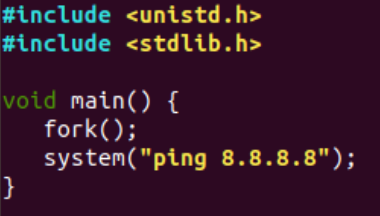
Let’s run the program and on another terminal run
pstree | grep ping-google-dns.
Figure 6 shows what the process tree looks like with one fork call. You will see in the screenshot below that the same program has two process IDs.

- Threads: Threads provide multiple executions within the program. A
process thread will not create a new process ID. Let’s compile this code
that runs three threads as
print-something(the compiled file can be downloaded from here).
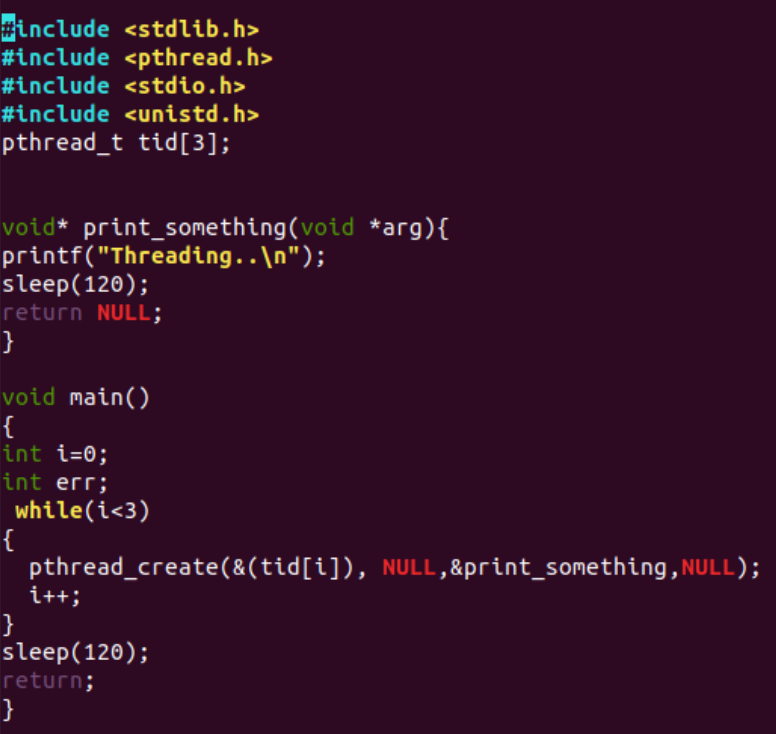
Now let’s run the program and run pstree | grep print-something on another
terminal. Figure 8 emphasizes what the process tree of a program that runs with
three threads will look like.

Process Monitoring Tools
Sysinternals Suite provides convenient GUIs for monitoring all processes that are running on a Windows machine (among other things). Microsoft’s ProcMon-for-Linux based on ProcMon and Intezer’s Linux Expl0rer inspired by ProcExp, are intuitive solutions for Linux process tracking.
System Calls
Only the kernel can perform changes outside of the process’s own memory space. The process must ask the kernel to perform tasks such as creating files or writing output. This is where system calls come into play.
Syscalls (system calls) are the interface used by the application to request services from the kernel. Syscalls are usually invoked via glibc wrappers and not directly to the kernel because of portability. The low level syscalls differ between architectures which is why glibc handles these differences instead of the developer.
Syscalls are an interface that the malware must pass through in order to cause actual harm to the system. Analyzing syscalls can help us understand how the file interacts with the system and how it operates behind the scenes.
strace is a powerful tool
to trace a file’s system calls. Run strace whoami on your Linux VM and take a
look at the output. Each row in the strace output is a syscall, and the first
syscall will be execve which stands for execute program. Each system call has
a return value that varies between calls. It can be a file descriptor (integer)
or 0 on success, -1 on error and more.
These are some interesting syscalls we will look for by analyzing the strace output:
open/openat - open and possibly create a file.
read - read from a file descriptor.
access - check user’s permissions for a file.
write - write to a file descriptor.
mkdir/mkdirat - make directories.
connect - initiate a connection on a socket.
socket - create an endpoint for communication.
execve - execute program.
Let’s try it ourselves. Run the
trace-me
file on your VM using strace. Use the -o flag to save the command output:
strace -o out.txt ./trace-me
Now, let’s read the strace output to see what happened on the system. Run
cat out.txt:
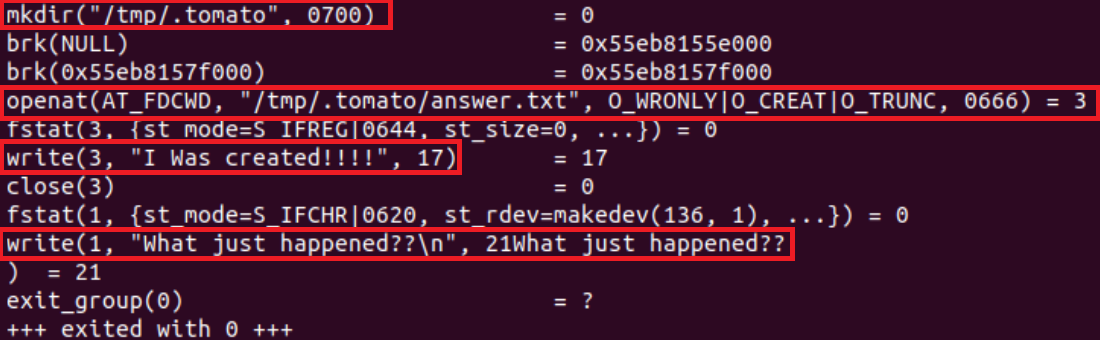
You will see the file creates the .tomato directory under tmp directory,
and creates a file answer.txt inside this directory. If you look carefully on
the flow, you can see the return value of openat for the answer.txt file is
3, which is the file descriptor. Then, write syscall, “I was created!!” uses
the file descriptor 3 as an input. This means that this text is written to the
answer.txt.
Tips:
- In most cases the syscalls output will be much bigger than the last example.
It is recommended to always save the strace output to a text
(
strace -o out.txt ./file). Make sure that you have a convenient text editor such as Sublime Text that will help you analyze the large text file. - To gain full visibility on all syscalls of the processes created by the
file, including forks, you can run
stracewith the fork flag-f(strace -f ./file). - The default strings length is 32. Use the
-v(verbose) and-s(string size) flags to see more characters (strace -v -s 150 ./file). - To reduce noise, you can choose which syscalls will be presented on strace
output using the
-eflag. For example, if you are searching for network-related calls together with read and write calls, you can runstrace -e network,read,write ./file.
Persistence
Once a malware finds its way into a compromised system, it will often attempt to achieve persistence in order to survive reboot. Another reason why malware developers add persistence capabilities is to harden removal efforts, which is also attempted by other malware families in order to gain a foothold on already compromised systems. This is more common among CoinMiners, which will search for other known Miners on a compromised machine and attempt to kill them, to be the only CoinMiner running on the system and ultimately win the machine’s resources. See War of Linux Cryptocurrency Miners: A Battle for Resources.
Detecting persistence methods is important for understanding how to respond to malware on a compromised machine. Killing the process is not always enough to mitigate the threat, the persistence methods should be cleared as well.
These are the most common persistence methods used by Linux malware:
Cron - Malware will create scheduled tasks to run periodically on a system using cron jobs. crontab and anacrontab are the configuration files used for cron and anacron services which are in charge of executing scheduled tasks. The malware will write registries to the configuration files which are located under:
/etc/crontab,/var/spool/cron/,/etc/cron.d/,/etc/anacrontab,/var/spool/anacron/.The following XMRig Miner dropper uses crontab as one of its persistence methods. Figure 11 emphasizes what a crontab registry looks like:

Figure 11: crontab registry written by a malware Note: Running
crontab -lwill list the existing cron jobs per user. Using root privileges, you can either runcrontab -l -u <user>orcat /var/spool/cron/crontabs/<user>for specific users. To view the cron jobs for all users, runcd /var/spool/cron/crontabs/ && grep *.Services - Linux has initialization scripts that are used to start services on system boot. The program in charge of starting the rest of the system will run as PID 1 (you can explore your
/proc/1directory). Malware will often attempt to gain persistence by creating a service which will run by the init program on boot. The init program varies between Linux distributions and versions, however, systemd is most common these days.rc.dandinit.dare older init services which are still used in certain Linux distributions. Learn more about why init.d was replaced by systemdThe service will commonly be found under the following paths:
/etc/systemd/system/,~/.config/systemd,/etc/rc.d/,/etc/init.d/.IPStorm Linux version is an example of a malware that gained persistence by creating a service under
/etc/systemd/system/storm.service. Figure 12 emphasizes the structure of a systemd service file.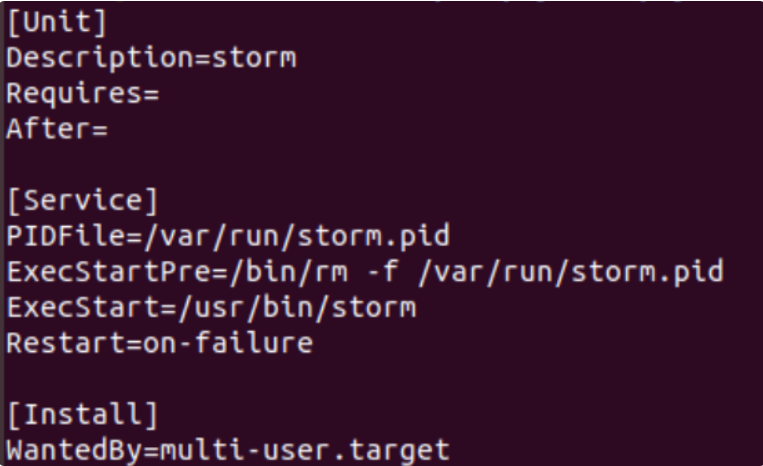
Figure 12: storm.service content Event Triggered Executions - Once a user logs in or a new shell session is created, Linux will automatically launch executables by using configuration files. These configuration files are bash scripts which can be edited to trigger a malware. Files locations:
/etc/profile.d,/etc/profile,/etc/bash.bashrc,~/.bashrc,~/.bash_profile,~/.bash_login,~/.profile. Linux Rabbit is a malware that uses the.bashrcto set up persistence.Graphical Desktop Autostarts - Similar to event triggered executions, once a user logs in via a graphical desktop environment such as GNOME or KDE, Linux will automatically search for desktop entries to execute applications on startup. A generic location for desktop entries is under
~/.config/autostart/. Other possible locations include:~/.kde/Autostart,~/.kde/share/autostart,~/.kde4/Autostart,/usr/share/autostart/,/etc/xdg/autostart/. The autostart service will have a.desktopsuffix. This persistence method is relevant for malware that targets endpoints.ElectroRAT’s Linux version gains persistence by creating a desktop entry under
~/.config/autostart/mdworker.desktop.Loadable Kernel Modules (LKM) - The Linux kernel is designed to allow loading of external pieces of code called kernel modules. Kernel modules are automatically loaded on system boot. Because the Linux kernel runs as root, and the modules can be loaded dynamically (using modprobe or insmod) with no need to reboot the system, this method is commonly used for rootkits as well. Malware that attempts to gain persistence via this method will create malicious kernel modules that will be loaded to the kernel and run on boot. The location of the kernel modules is under:
/lib/modules/$(uname -r). By runninglsmodyou can see what kernel modules are currently loaded.Hijack Execution Flow - Dynamically linked binaries use shared libraries during runtime (in the previous article we explained the differences between dynamically and statically linked files). These libraries are loaded by the dynamic linker which searches for libraries on absolute paths and common directories.
LD_PRELOADis an optional environmental variable containing paths to shared libraries or objects. The dynamic linker will load the libraries inLD_PRELOADbefore loading any other shared library (including libc). Malware developers can setLD_PRELOADto point to malicious libraries. Once a dynamically linked binary is executed on a compromised machine, it will load the malicious library too. HiddenWasp is a malware that usesLD_PRELOADfor persistence.
To summarize this section, there are different startup locations which can be used as persistence methods for malware. However, the most commonly used methods are services and cron jobs.
Tip: A convenient way to check if a malware attempts to gain persistence is
by analyzing the syscalls (strace output) and searching for known methods. For
example, you can run cat strace_output.txt | grep cron to search for any
interaction with the cron process.
Network Sniffing
So far we covered how to monitor a file’s activity internally on the system. You can understand if a malware interacts with a C&C or external services by analyzing network-related syscalls such as socket and connect. However, syscalls are not the way to go for network monitoring. You should use a packet sniffing and network monitoring tool to analyze the traffic. The most popular tools for this purpose are tcpdump and Wireshark, both based on libpcap. tcpdump is a CLI tool that should be preinstalled on commonly used Linux distributions. Wireshark has similar functionalities to tcpdump and provides a convenient GUI.
To install Wireshark on your VM run the following commands:
sudo add-apt-repository ppa:wireshark-dev/stable
sudo apt install -y wireshark
sudo wireshark
Tip: Make sure to run Wireshark before running the file you are analyzing so that you won’t miss any packets related to the malware.
Sandboxes
Sandboxes can accelerate analysis by providing context about the file’s behavior on a machine without the hassle of opening a VM, running the malware and relevant tools. They will not always replace a hands-on, deep dive analysis of a VM, but sandboxes help you pinpoint interesting behaviors while saving you time.
Here are some relevant tools:
- Hybrid-Analysis - Online
- Hatching-Triage - Online
- LiSa - Open-source
Real Life Example
Let’s practice your dynamic analysis skills! We will begin with initial analysis to gather insights and then proceed to dynamic analysis. Our mission is 1. Understand how the file behaves and 2. See how dynamic analysis tools come in handy.
Our test sample? This ELF malware found in the wild.
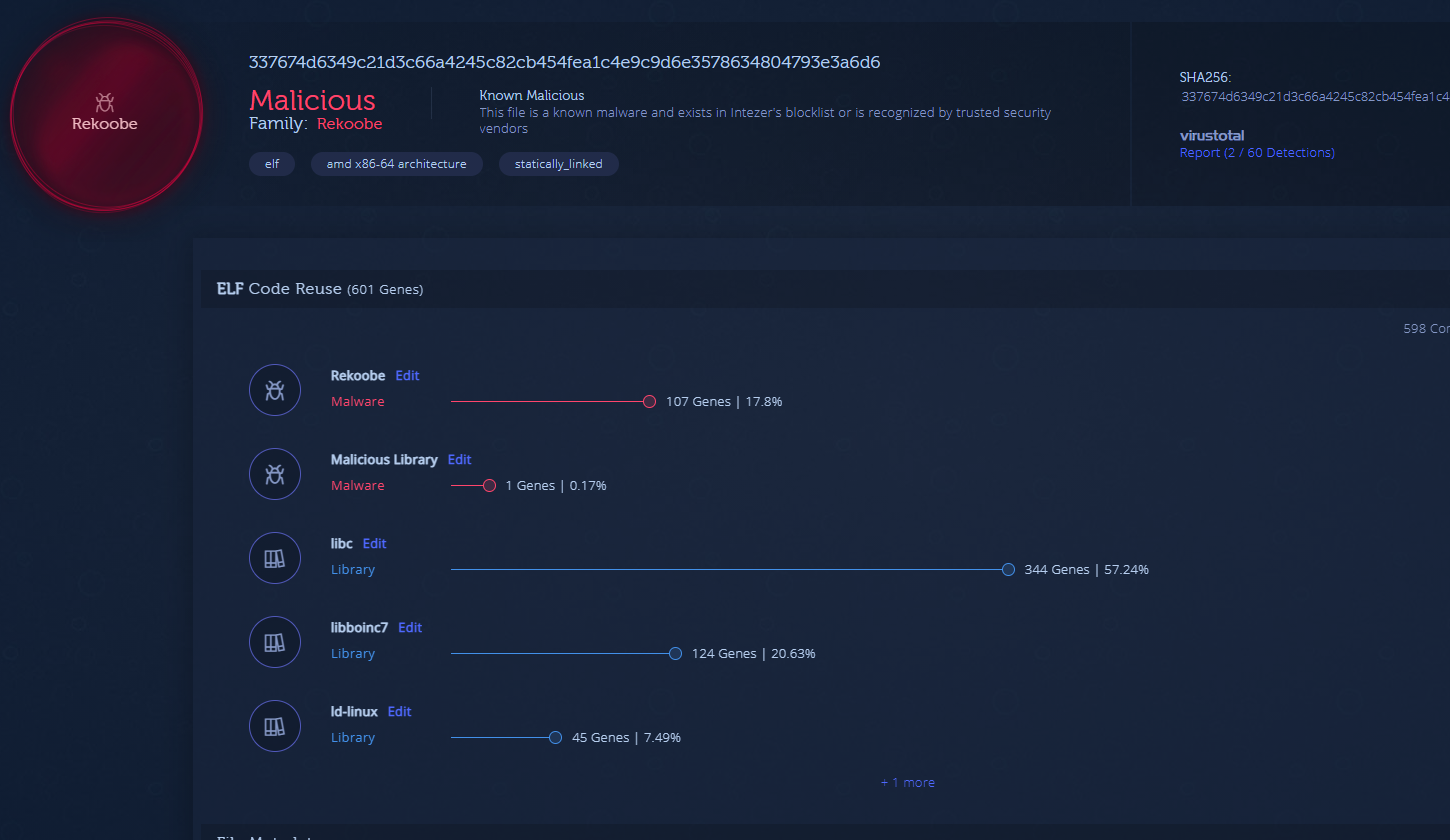
A quick side note. Uploading this file to Intezer Analyze classifies it as Reekoobe, based on code reused from previous Rekoobe samples. We will analyze the file manually for practice anyway.
Step one, download/copy the sample to your VM. Make sure:
- Your environment is prepared based on the Analysis Environment Preparation section.
- You have a clean snapshot of your VM with the relevant tools. In this example we will be using Wireshark and Sublime Text editor. Other tools should be preinstalled on the machine.
Let’s begin with static analysis and try to read the file’s symbols to see if
there are any human readable function names. Run readelf -s sample. There is
no output for the command, which means the file has been stripped.
Let’s read the file’s program headers by running readelf -l sample. The
following image shows the command’s output:
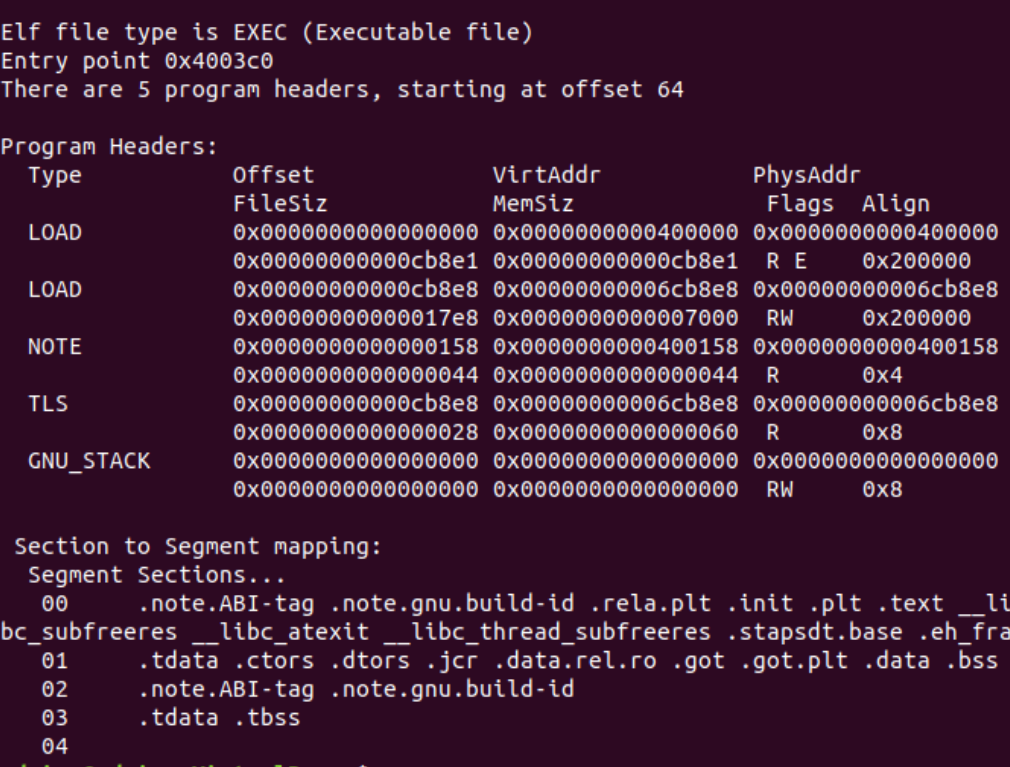
We can tell the file is statically linked because there is no dynamic symbols table or dynamic program header.
Let’s run the strings command on the file. Because the file is statically linked you should expect to see a large number of strings related to libc. Figure 14 is a snippet of the strings commands output:
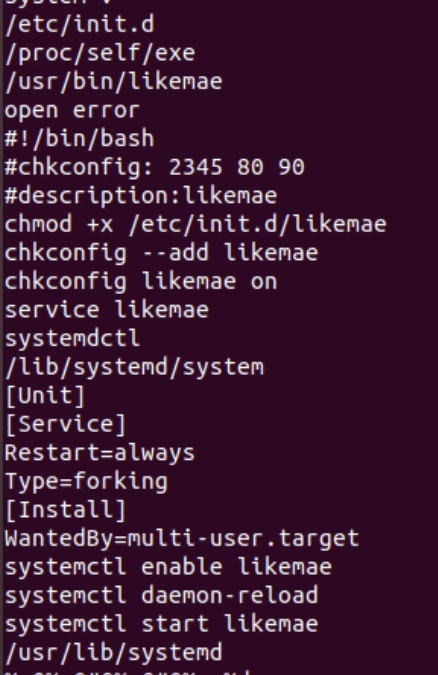
The strings snippet is a big indicator that the file will attempt to create a
service to gain persistence. “systemctl enable likemae” and other strings can
help us understand that the service name will be likemae. Another interesting
string is c[.]linux-hosts[.]com which could be the C&C.
Now that we have gathered enough information in the initial analysis step, let’s proceed to dynamic analysis.
First, prepare a running program of Wireshark and then run the sample with
strace: sudo strace -f -o out.txt ./sample. We will analyze this malware as
if it ran with a privileged user to see its full capabilities.
Open the out.txt with a convenient text editor such as Sublime Text. The
following snippet shows the beginning of the strace output:
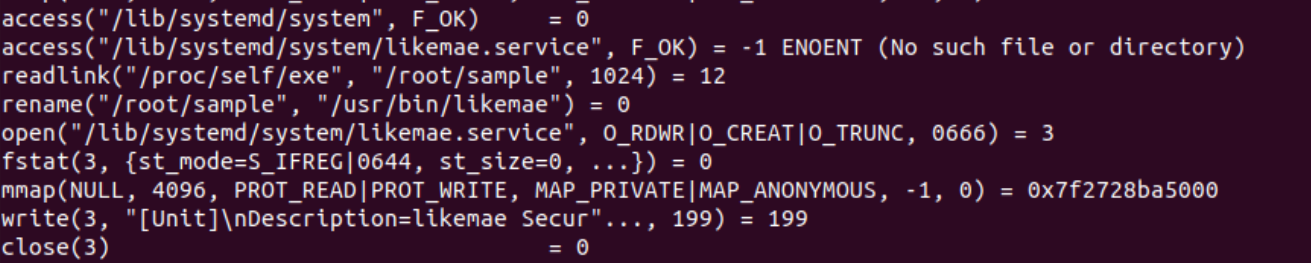
Analyzing syscalls from the snippet, it’s clear that this malware checks for
the existence of likemae.service with the access syscall. The return value
is -1 because the service doesn’t yet exist on the machine. The malware renames
the file and locates it under /usr/bin/likemae using the rename syscall.
Next, using the open syscall, the malware creates likemae.service and
writes to it.
Let’s view the service’s full content:
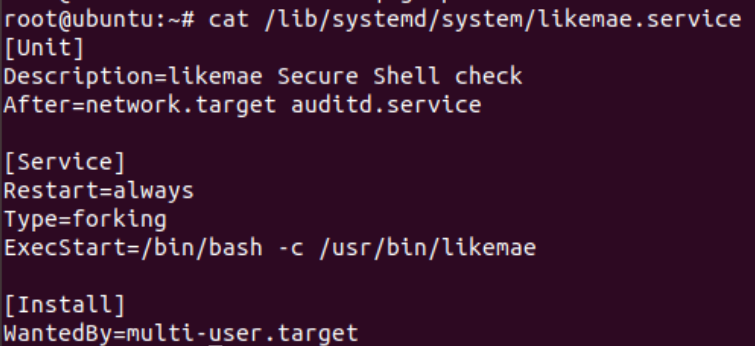
You can also use grep to find interesting syscalls. Run cat out.txt | grep exe
to see all executions created by the malware.

The malware made sure that the likemae service would run. Check that the
service is indeed active on your machine by running systemctl | grep likemae.

So far, you know the malware created persistence on the machine using the
service creation method and copied itself to the /user/bin/likmae. You can
also tell the process that we ran has exited after establishing persistence.
Let’s check if a process called likemae is currently running on our system. Run
pstree -p | grep likemae (-p flag to retrieve the process ID).

If we run cat /proc/1503/cmdline, we will see that is /bin/bash. This is
because the process was triggered by the service.
Now that the service exists and the malware established persistence, you can
expect the new malware process to perform different actions on the system.
Attach strace to the likemaes’s PID by running strace -p 15083.
Analyzing syscalls we can understand that the process attempts to connect to
the c[.]linux-hosts[.]com host and then sleeps for 30 seconds (see
nanosleep syscall). The following snippet shows the connection attempt loop.
You can see the syscalls that are made in order to connect to the C&C.
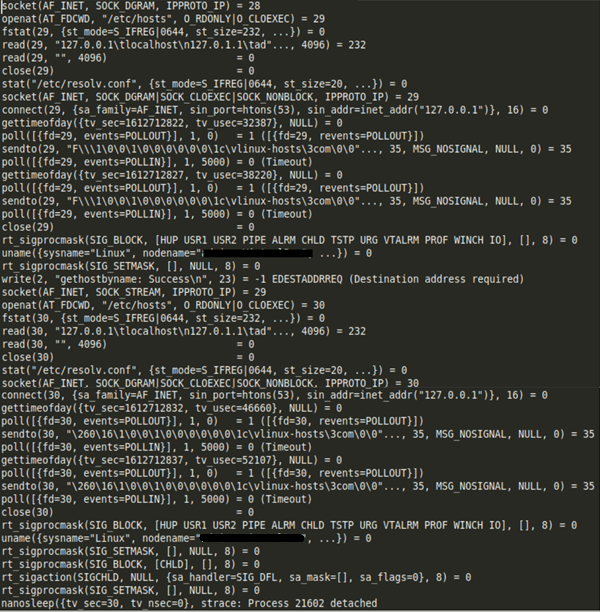
You can view the network connection attempts in Wireshark as well.

In Figure 20, you can see the host DNS resolution and the attempt to reach it via TCP. The TCP connection is not established, meaning the host doesn’t reply with a [SYN,ACK] packet but rather a [RST,ACK] response is sent back. The port the malware attempts to connect to on the C&C is closed.
Because the C&C is not reachable as expected, we have essentially come to a “dead end” with the dynamic analysis step. You can still explore the domain for other open ports but we will not dive into it further in this article. Nonetheless, you gained crucial insights on how the malware operates once it runs, how to detect it on compromised systems, and how to clear the malware from your system.
Tip: Some malware behave differently when they run as a privileged vs. an unprivileged user. The malware we have analyzed will not gain persistence if it runs as an unprivileged user. It is recommended to run the file as both privileged and unprivileged users to understand the full spectrum of its capabilities.
Wrap-Up
We reviewed ELF dynamic analysis and detailed the different components and tools relevant for this step. You learned how to gather insights about a file’s behavior using these tools. You also learned how insights gathered during initial analysis can help you focus on certain components during dynamic analysis.
There are certain cases where you will hit a dead end during the dynamic analysis process. The C&C could be down, the malware runs on a particular environment or time zone, and more. Remember, the goal in dynamic analysis is to gather additional insights on how the malware behaves. This will help you detect the malware on compromised systems, collect indicators related to the malware such as file names, C&C, persistent methods and more. This can lead you to connect the malware to other tools, campaigns and/or threat actors.
Dynamic analysis should be done responsibly. The safety of your system and network together with other machines should be taken into consideration when analyzing malware dynamically.
What’s Next?
Next up you will learn how to get payloads from packers and loaders by extracting memory dumps.
Appendix
These tools and commands were used or mentioned in this article: